For a long time now the technique that data base designers have used to cope with the jungle that is data in the corporation is to use a data model. The world of corporate data is messy, tangled, and disorganized and full of inconsistencies. By building a data model the data base designer has a start to organize the chaos of data that is in the corporation.
In addition to forming a clear picture of data, data models also allow data to be abstracted. The abstraction of data is an enormously valuable tool for dealing with the vagaries of data.
There is then good reason for using the data model as a tool for coping with the design and management of corporate data.
But once you enter the world of data modelling you find that there are actually different kinds of data models. It is a mistake to think that there is just one kind of data model, because that simply is not true. In fact, there are several very different kinds of data models for the variety of data found in the corporation. The fact that there are different kinds of data models should not come as a surprise given that there are different kinds of data found in the corporation.
The first major differentiating factor that arises when looking at data models is the separation of data models between structured data and textual data. There is one type of data model for structured data and an entirely different type of data model for textual data. And given the stark differences between structured data and textual data this should be no surprise.
The structured data model centers around an ERD – entity relationship diagram. The structured data model contains such things as keys and attributes. The ERD based data model is hierarchical and has a high level of modelling and a lower level of modelling.
The data model for the world of text is focused around a taxonomy and/or an ontology. The taxonomy contains classifications of some object.
One of the major differences between an ERD and a taxonomy is that the ERD based data model is inward facing, looking at the objects and the processes inside the corporation. And the taxonomy for textual data is external facing, looking at the world outside the corporation. This difference between the two types of models is subtle but very real.
The ERD based structured data model can be further divided into three types of models – an operational data model, an analytical data model, and a KPI data model. The operational data model looks at the internal data and systems of the corporation. The analytical data model looks at the foundation of data that will serve as a basis for analytical processing. And the KPI data model serves as a basis for the end user analytical KPI activities.
Each of these different types of data models serve different audiences in the corporation. The operational environment is the day to day environment where detailed decisions are being made. The operational model serves primarily the clerical community. The shop floor supervisor, the airline agent, the bank teller are all using operational systems to conduct their daily business. The analytical foundation is the foundation of data that serves the analytical community. The financial analyst, marketing analyst and the sales analyst all make use of analytical data. Deciding which marketplace to enter, deciding what product packaging changes need to be made, deciding how to advertise a product are all examples of analytical work going on in the corporation.
KPI’s are nothing more than a regularly appearing form of data used in analytical processing. But KPI’s require yet another kind of data in the corporation. KPI’s require summarizations of data and other calculations at regular intervals – weekly, monthly, quarterly and so forth. Typical measurements of KPI might include monthly customer churn, quarterly cash on hand, annual profitability and so forth. There is a different kind of data and a different kind of data model needed for building and maintaining KPI’s.
The textual data model is something called a taxonomy. In its simplest form a taxonomy is merely a classification. There are two basic types of taxonomies – specific taxonomies and generic taxonomies. Specific taxonomies are those taxonomies that are specific to a given industry. For example, there are medical taxonomies, legal taxonomies, accounting taxonomies and engineering taxonomies. Each of these taxonomies have terms and words that are rarely found outside of their domain. For generic taxonomies there are positive sentiment and negative sentiment. Or there are negations and conjunctions.
The structure of the different kinds of data models is shown by -
THE STRUCTURED OPERATIONAL DATA MODEL
So what does the data model for structured operational data contain? The data elements found in structured operational data includes such things as –
Customer name
Customer address
Product id
Product description
Sale amount
Sale date
And so forth.
The information found in this class of data is used for the day to day operations of the corporation.
As a rule, the operational data elements can be updated.
Note that no calculated data – derived data – is found in the structured operational data model. The structured operational data model is used only for detailed, non calculated data. The problem with calculated data appearing in the operational data model is that the calculated data is subject to constant change. One day the calculation is made one way. The next day the calculation is made another way. When the data modeler allows calculated data into the structured operational model, the model is never stable or complete. When calculated data is allowed in the structured operational data model, the model is eternally changing.
THE STRUCTURED ANALYTICAL DATA MODEL
Structured analytical data is data on which analysis is made. In many ways structured analytical data is very similar to structured operational data. The one difference is that structured analytical data should not contain data that is purely operational. As an example of purely operational data consider the data element – telephone number. A telephone number is certainly useful in the operational environment. But a telephone number is not useful in the analytical environment. And there are any number of other elements of operational data that have strictly an operational usage.
THE STRUCTURED KPI DATA MODEL
Structured KPI data models are typically very fleeting objects. They exist one moment and are changed in the next moment. They are as unstable as looking out the window and seeing which way the wind is blowing. They are subject to immediate and constant change.
The KPI data model is necessary for the construction of the KPI. In many cases the KPI data model exists only in the head of the designer. But in whatever form it exists, it is still necessary for the construction of the KPI.
Unlike the operational model or the analytical model, the KPI data model is filled with calculated data. Not only must the data be documented, but the –
Selection criteria for the data, and
Formula for calculation
must be documented.
THE GENERIC TAXONOMY
A generic taxonomy is one that is filled with classifications that are generic to the subject being discussed. Classical generic taxonomy words are positive and negative sentiment. But there are other types of generic sentiment terms, such as negation and conjunctions. In the case of generic taxonomies, it does not matter what subject is being discussed. The subject could be anything. But the generic classification remains the same regardless of the subject being discussed.
THE SPECIFIC TAXONOMY
Specific taxonomies are taxonomies and classifications that are specific to some discipline or school of thought. Typically, specific taxonomies are aligned with an industry. For example, there are medical taxonomies, accounting taxonomies, legal taxonomies and so forth.
AN EXAMPLE
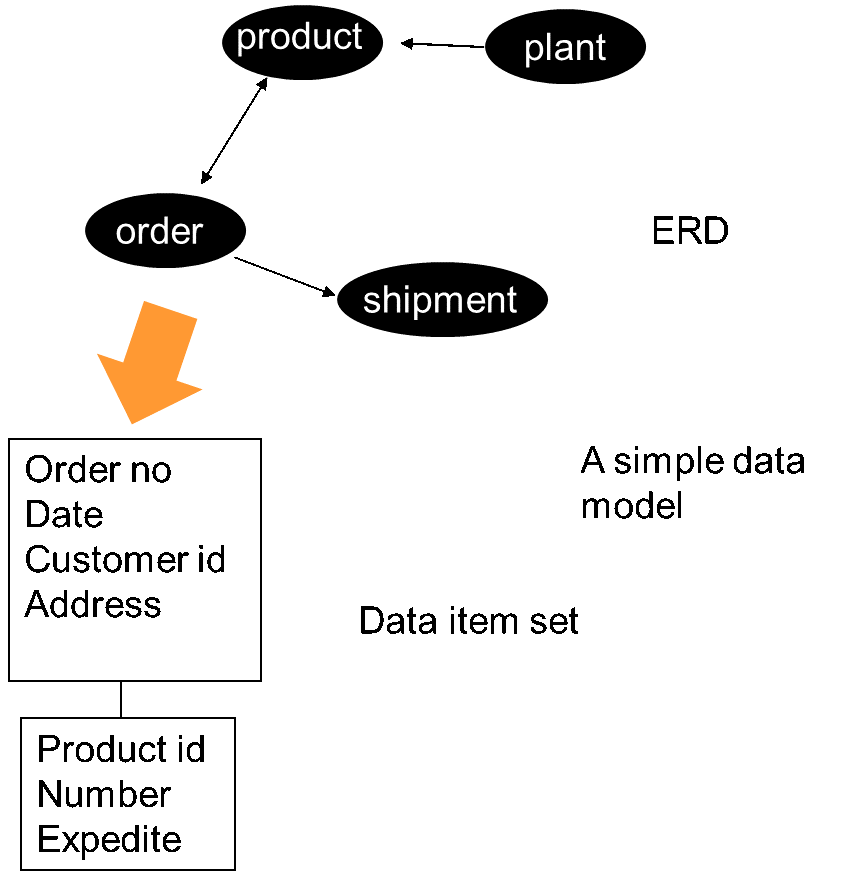
As a simple example of what a structured ERD data model might look like, consider the following diagram –
In the simple ERD structured data model, there are two levels of modelling – an ERD level and a dis (or data item set) level of modelling. The ERD level of modelling depicts the major subject areas of the corporation and their relationship to each other. The arrow between the different entities indicates the cardinality of the relationship. In many models the ERD level structured model is not considered to be complete until the cardinality for all relationships is a one to many relationship. In other words, no many to many relationships are allowed between any two entities in the structured ERD data model. The act of converting a many to many relationship to a series of one to many relationships is called the resolution of the cardinality.
Each of the entities in the structured ERD data model has a more descriptive and complete counterpart at the dis level. The dis level contains attributes, keys and other characteristics of the data. Each dis corresponds to the entity found at the ERD level.
In many ways the ERD and the dis correspond to the mapping of the world. The ERD is analogous to a globe of the world and the dis is equivalent to a country of the world – Germany, Brazil, China, etc.
The taxonomies that are found are outward facing, depicting the external world. The taxonomies that are found can be about anything.
The taxonomies that are found in the data model might look like
Often times taxonomies are related to an ontology. An ontology is nothing more than a series of related taxonomies.
AN ONTOLOGY
An example of an ontology might be -
In the ontology shown there are three taxonomies. The taxonomy for state relates to the country taxonomy. And the taxonomy for city relates to the state taxonomy. Together the taxonomies form an ontology.
DATA OVERLAP
It is simply a fact of life that the operational data model shares much data with the analytical data model. It just makes sense that many of the data elements used for operational processing also are useful for analytical processing. The consequence is that there is significant overlap between the two types of models.
NON OVERLAPPING DATA
But there is some small amount of data elements that do not belong in both data models. Telephone number does not belong in the analytical data model. And by the same token, foreign exchange rate may not belong in the operational model. The only way that foreign exchange rate belongs in the operational data model is if operational processing includes foreign exchange rate processing.
A RELATIONSHIP BETWEEN THE ERD DATA MODEL AND THE TAXONOMY
So, is there any relationship between the ERD structured data model and the text based taxonomies? The models are very similar when it comes to serving as a lighthouse – a point of reference – when dealing with data and text. In that regard there is great similarity between the two types of models.
But there is a great difference in that the ERD data model is inward facing into the corporation while the taxonomy is pointed to the world external to the corporation.
But there is one other major difference between the model types. The taxonomy must incorporate both text and context into the model. When you are dealing with text, you MUST also deal with the context of the text. It is not optional.
But there are other differences.
The structured ERD data model has keys and attributes and the taxonomy does not. The assumption with the ERD structured data model is that if any data needs to be changed that a change can be accomplished. But with textual data the assumption is that the raw text can never be changed.
When looking at the different data models it is seen that there are certain similarities and some distinct differences.
In any case, the structured data and the text of the corporation need a lighthouse to prevent the designer from crashing on a rocky and cold shore.


Hi Bill, good to see you here. I am still banned off Linkedin, X and pretty much every other place on the planet.