
THE DATA LAKEHOUSE

EVOLUTION TO THE DATA LAKEHOUSE
By W H Inmon
Most evolutions occur over eons of time. Observing an evolution in real time is almost always an impossibility. The evolution occurs so slowly that the steps in the evolution are not observable on a day to day basis. Watching an evolution occur makes watching paint dry look like a spectator sport.
THE EVOLUTION OF TECHNOLOGY
The evolution of computer technology has occurred at warp speed as far as evolutions are concerned. The early origins of the computer evolution can be traced back to the 1960’s.
Once upon a time life was simple, when it came to the computer. Data went in, was processed, and data came out. In the beginning there was paper tape. Then came punched cards. Then magnetic tape. Then disk storage.
The evolution of computer technology in the early days occurred at the speed of light.
One day computer applications were being built. And presto! – for a variety of reasons – corporations fell in love with their applications -
In fact, corporations liked applications so much that the applications grew like weeds in the springtime. Soon there were applications everywhere.
THE PROBLEM OF DATA INTEGRITY
And with the growth of applications came a new and unanticipated problem. In the early days of the computer, the end user complained about not having his/her data. But after the mad rush of applications occurred, the end user then complained about not finding the RIGHT data. The end user switched from not being able to find data to not being able to find the right data. This sounds like an almost trivial shift, but this shift was anything but trivial.
With the proliferation of applications came the problem of integrity of data. The problem with the advent of large numbers of applications was that the same data appeared in many places, all with a different value. In order to make a decision, the end user had to find WHICH version of the data was the right one to use among the many applications. If the end user did not find and use the right version of data, incorrect decisions might be made. And trying to find the correct data on which to base decisions was a gargantuan task -
The challenge of finding the right data was a challenge that few people understood. But over time people began to understand the complexity of finding the right data to use for decision making. People discovered that they needed a different architectural approach. Merely adding machines, technology and more consultants to their collection of applications made matters worse, not better. Adding more technology simply exaggerated the problems of disintegrity of data.
THE DATA WAREHOUSE
Thus born was the data warehouse. The data warehouse caused disparate application data to be placed in a separate physical location. The data warehouse became an architectural solution to an architectural problem.
But merely integrating data and placing it into a physically separate location was only the start of the architecture. In order to be successful, the designer had to build an entirely new infrastructure around the data warehouse -
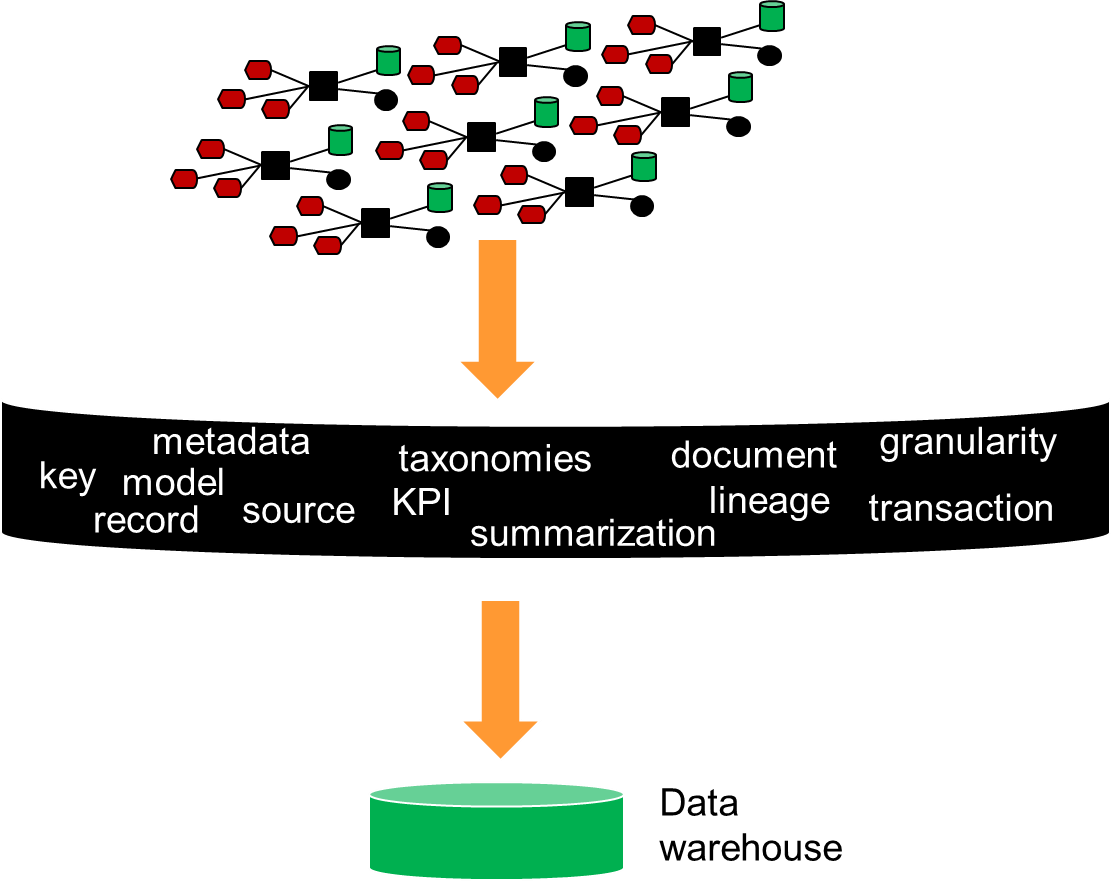
The infrastructure that surrounded the data warehouse was designed to make the data found in the data warehouse usable and able to be easily analyzed. Stated differently, as important as the data warehouse was, without the surrounding analytical infrastructure, the end user found little value in the data warehouse. The analytical infrastructure surrounding the data warehouse contained such things as –
Metadata – a guide to what data was located where
A data model – an abstraction of the data found in the data warehouse
Data lineage – the tale of the origins and transformations of data found in the data warehouse
Summarization – a description of the algorithmic work designed to create the data in the data warehouse.
KPI’s – where are key performance indicators found
ETL – technology that allowed applications data to be transformed automatically into corporate data
THE ISSUE OF TIME
But data warehousing opened other doors for analytical processing. Prior to data warehousing there was no convenient place to store older and archival data easily and efficiently. Prior to data warehousing it was normal for organizations to store a week, a month, or even a quarter’s worth of data. But it was rare for an organization to store a year or five years’ worth of data. But with data warehousing organizations could store ten years or more worth of data.
And there was great value in being able to store a longer spectrum of time valued data. For example, when organizations became interested in looking at the buying habits of a customer, understanding past buying patterns led the way to understanding future buying patterns. The past became a great predictor of the future. So, data warehousing added the dimension of greater length of time for the storage of data to the world of analysis.
STRUCTURED DATA
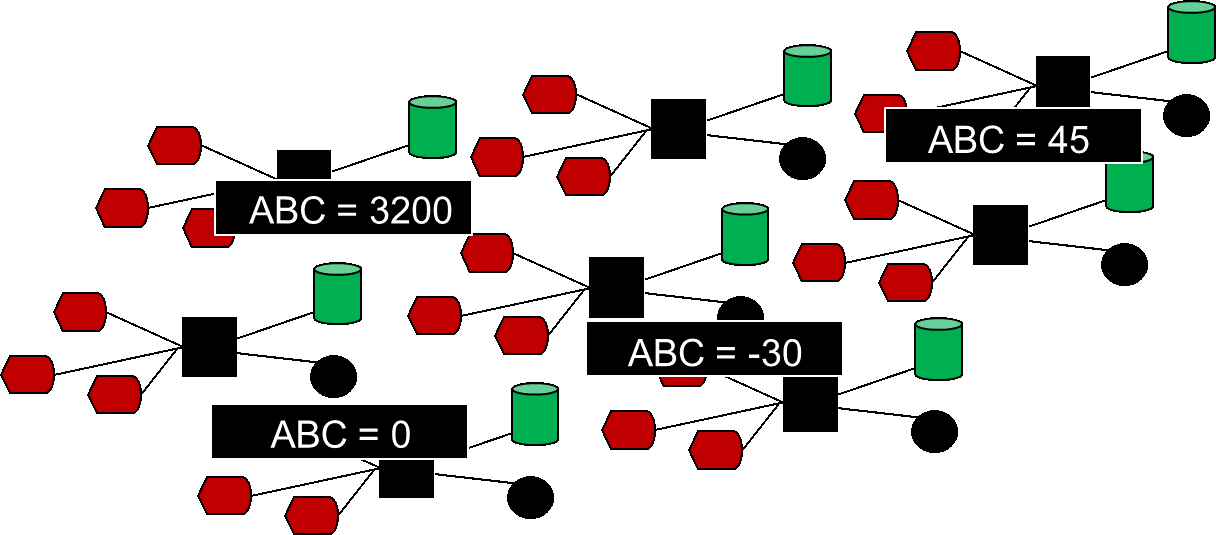
As important and as useful as data warehouses are, for the most part data warehouses centered around only the structured, transaction based data of the corporation. It is worth pointing out that there are a lot of other data types that are not found in the structured environment or in the data warehouse.
ALL THE DATA IN THE CORPORATION.
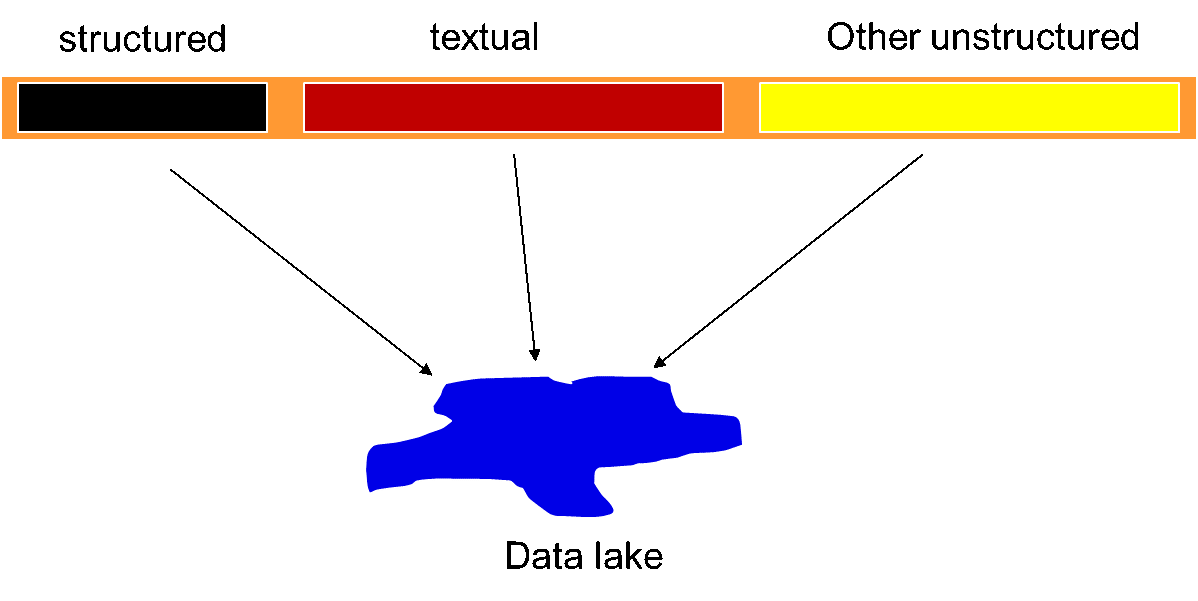
In order to see what other data – other than transaction based, structured data - resided in the corporation, consider the simple graph which portrays all the data found in the corporation -

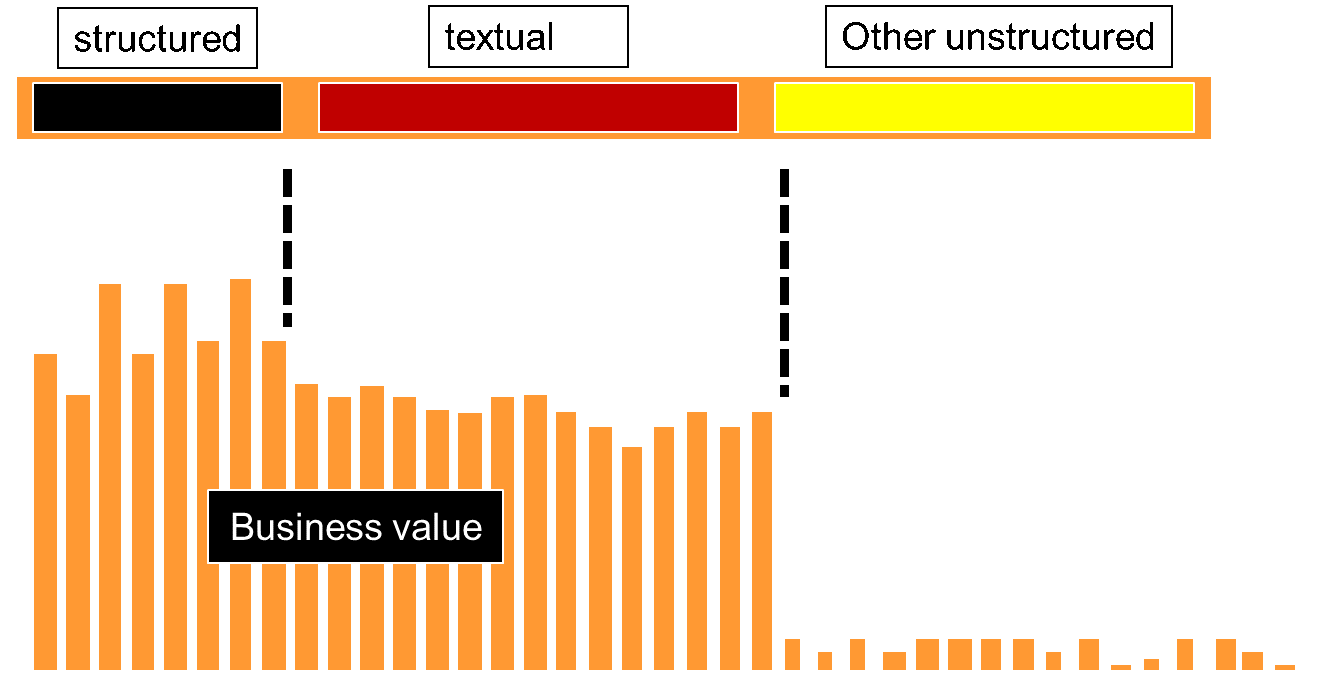
All the data in the corporation can be divided into three categories – structured data, textual data and other unstructured data –

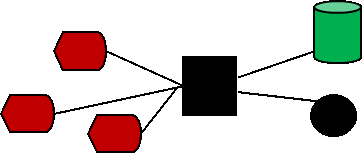
Structured data is typically transaction based data that is generated by the organization conducting day to day business activities. Textual data is data that is generated by letters, email, conversations that take place inside the corporation, and so forth. Other unstructured data is data that has other sources, such as IoT data and analogue based data.
WHERE IS BUSINESS VALUE?
An interesting aspect of this division of data in the corporation is that there is a very different relationship between the different classifications of data and their relationship to business value. Not surprisingly there is a very strong relationship between structured data and business value. That is, after all, where the day to day business of the corporation is conducted. And there is also a strong relationship between textual data and business value. Text is the very fabric of the business. But when it comes to the other unstructured data, there is much of the other data that simply has very limited business value. For example, for surveillance data, only a few frames of surveillance are typically of interest. Usually the surveillance data contains lots of data that has no business use or relevance.
THE DATA LAKE
The data lake then is a simple amalgamation of ALL of the different kinds of data found in the corporation. When the data lake was first conceived, it was thought that all that was required was that data should be extracted and placed in the data lake. Once in the data lake, the end user could just dive in and find data and do analysis. Indeed, this is exactly what happened. Then the end user quickly discovered that merely putting data into a data lake and just leaving it there was not a terribly productive thing to do. Using the data in the data lake was a completely different story than merely having the data placed in the lake. It was the same circumstance – that of usability of data - that technicians found when application data was collected in an earlier day and age.
In the day and age of data warehousing, technicians discovered that it was not sufficient to merely collect the data. Technicians in the day of data lakes made the same discovery. In the world of data lakes, technicians had to build an infrastructure around the data in the lake and integrate the data in the data lake in order for it to be useful to the end user.
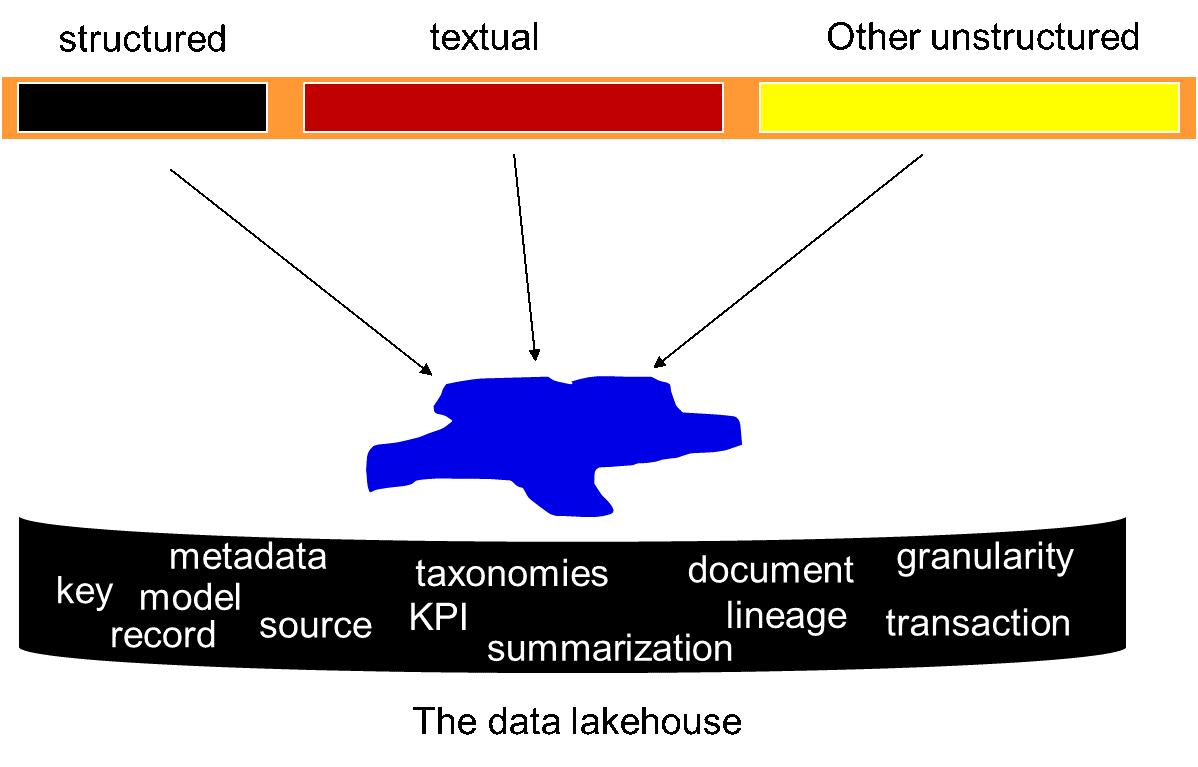
The same phenomenon is true for the data lake. It is not sufficient to merely collect a lot of data and hope that someone can make sense of it. To turn a data lake into a useful architectural feature, it is necessary to also build an infrastructure that surrounds the data lake and to integrate the data that resides in the data lake. It is this infrastructure and integration that enables the data in the data lake to be used for analysis.
The analytical infrastructure that is needed in order to make the data lake effective is very similar to the analytical infrastructure that was built years ago for data warehouses. The supporting analytical infrastructure for the data lake must include –
Metadata – a guide as to what is in the data lake
Integration – the work done that allows different types of data to be related
Models – an abstraction of what the data represents
Lineage – a description of the transformations the data has passed through
Granularity – a description of the level of detail the data resides at
Algorithms – an identification of the logic used to summarize or otherwise transform the data found in the data lake
KPI’s – where they are and how they are calculated and what they mean
Schedule of activities – how data is loaded into the data lake
Archival schedule – how data is exited from the data lake
Alias – what alternative names the data has
Taxonomies – taxonomies that describe how the textual data is related
And so forth.
All of these forms of information are necessary in order for the end user to make sense of the data found in the data lake.
ENTER TEXTUAL DATA
One of the most useful aspects of the data lake is the merger of textual data and classical structured data. Traditionally only structured data has been collected in the data lake. (It is true that text can be stored in a raw form in the data lake. But once stored in a raw form, there is not much that can be done with raw text.)
When textual ETL is added to structured data it is possible to store and organize both structured data and textual data in the same environment. And when textual data is combined with classical structured data, the result is analytical capabilities that are very powerful and very distinct.
In addition to needing the analytical structure of data found in the data lake, it is also necessary to integrate the data found in the data lake, if the data lake is to become useful.
A SIMPLE EXAMPLE – THE 360 DEGREE VIEW OF THE CUSTOMER
As a simple example of the value of adding text to classical structured data, consider the discipline of finding the voice of the customer – finding the 360 degree view of the customer-

EVERY business – from the doctor to the car salesman to the rodeo clown to the chemical engineer needs to know what the audience being served thinks of the product or service being fulfilled by the business. There are no exceptions to this rule.
Once the 360 degree view of the customer is known, the company can put themselves into a proactive state. But when the voice of the customer is not heard, the best the business can do is be in a reactive state. And from a revenue, market share and profitability perspective, the business is ALWAYS better off being in a proactive state.
For these reasons and more, every business needs to be able to listen to their customer.
MEASURING SALES
So how have companies traditionally gone about trying to hear the voice of their customer? One way the business has tried to listen to their customer is by gauging sales. The more sales the business has, the better the marketplace likes the products or services. The less sales the business has the less the marketplace likes the products or services of the business. So merely watching the pattern of sales is a time honored means of gauging customer satisfaction.
But measuring sales activities is a crude and ineffective way to listen to the voice of the customer. It is crude because it is reactive. By the time the customer makes a decision to buy or not buy, it is too late to influence the customer.
The horse is already out of the barn.
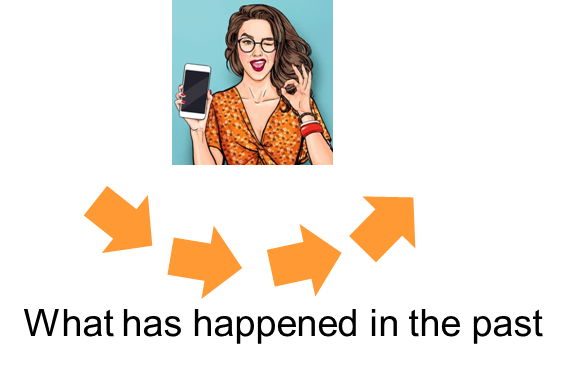
And how are sales measured? Sales are measured by examining structured information.
Measuring sales shows you what has happened in the past –
In order to be effective, you need to get into the head of the customer at the moment in time when the customer is making up their mind. So how do you go about getting into the head of the customer? You do that by listening to conversations the customer is having – in call centers, in casual conversations -and by looking at what the customer is writing – in emails, in letters, on the Internet. There are many places you can look to hear what your customer is saying.
By examining what the customer is saying, you can understand what the customer is thinking BEFORE he/she makes a buy or no buy decision.
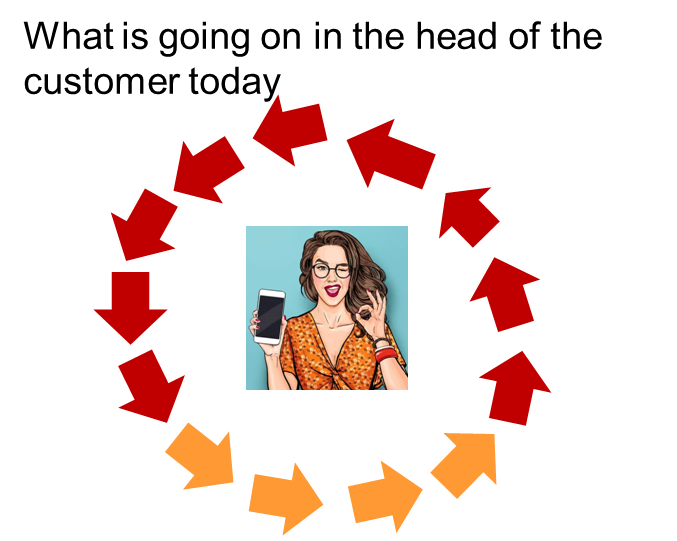
The information you need for getting into the head of the customer is readily available. But the information of understanding the mindset of the customer is all in the form of text.
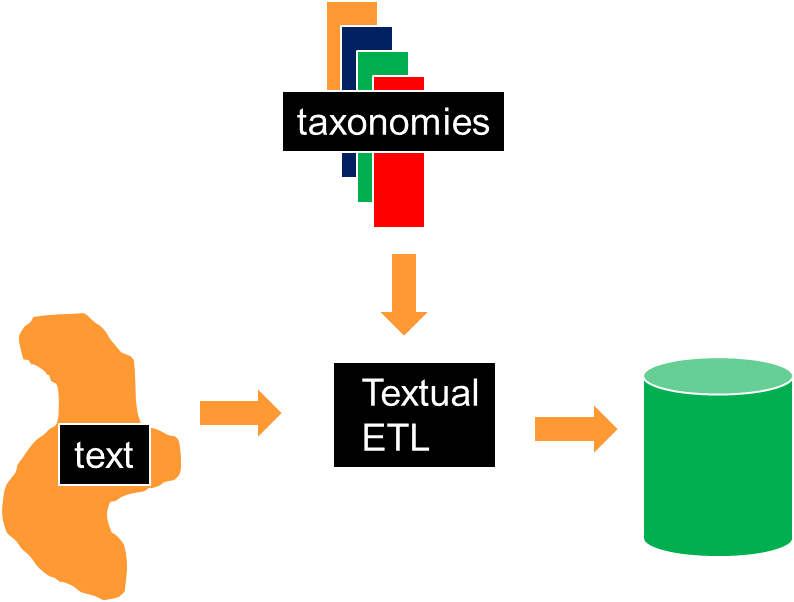
TEXTUAL ETL
Fortunately, there is technology known as textual ETL. With textual ETL you can read the text and transform the text and integrate the text into a standard data base format. And in doing so, you can now start to blend structured data and text together. Once text and structured information are cast into the form of a data base, they can be meaningfully compared. And in looking at both text and structured information, you can have a true 360 degree of what the customer is thinking. And you can now operate your business in a proactive fashion, not a reactive fashion.
OTHER APPLICATIONS
It is noteworthy that there are many more application arenas than the voice of the customer where reading and analyzing text is important. Other worlds dominated by text include contracts, warranty claims, insurance claims, medical records, and so forth. As important as the voice of the customer is, it is only one of many disciplines touched by text.
THE DATA LAKEHOUSE
One of the ingredients in creating a usable data lakehouse is in being able to capture and manage text. The text, once captured, is turned into a standard data base format. Once in the form of a standard data base format, the data can be analyzed rapidly by the computer. This capability is provided by Forest Rim technology’s Textual ETL –
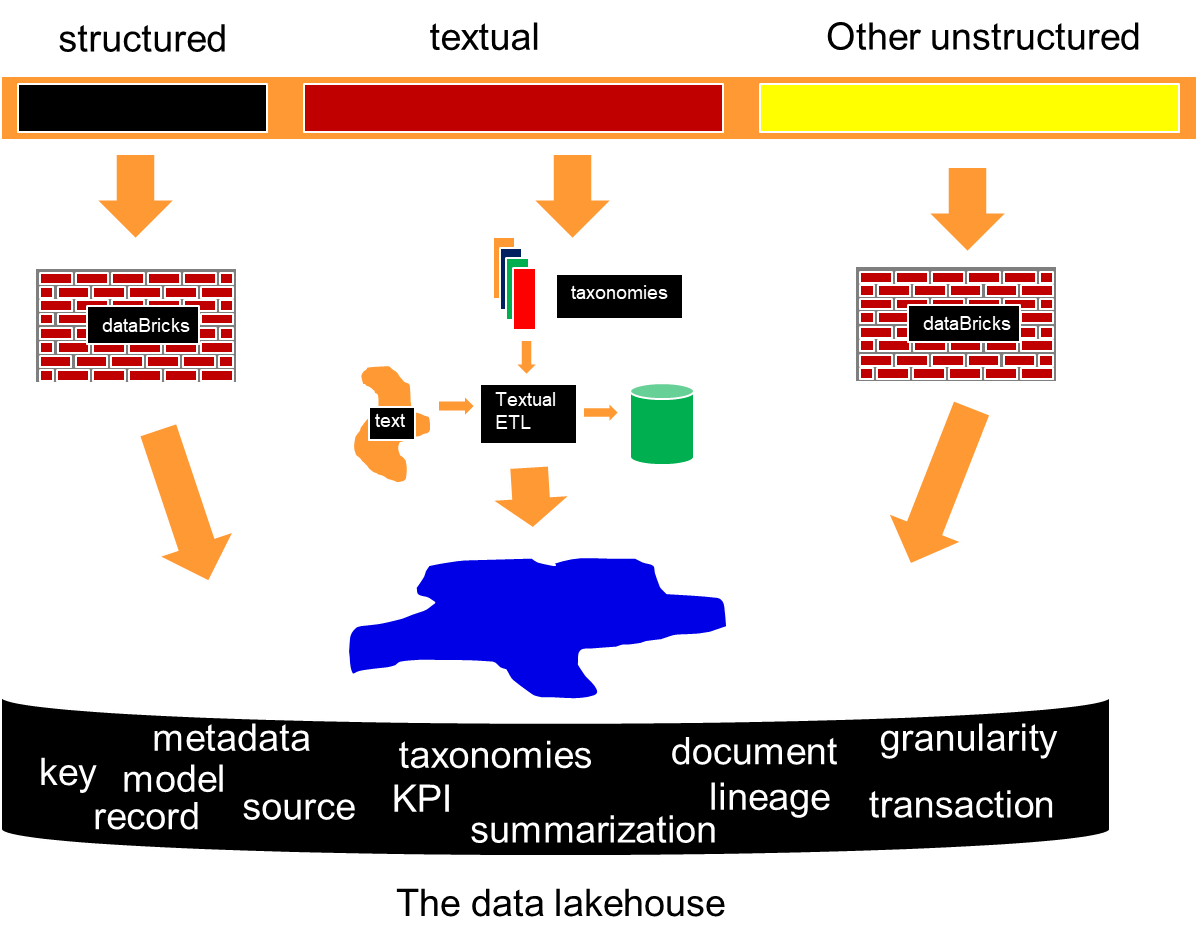
STRUCTURED DATA AND OTHER UNSTRUCTURED DATA IN THE DATA LAKE
However, text is only one part of the equation when building a data lake. The other parts of the equation in the data lake are structured data and other unstructured data. All three types of data are needed for a successful and usable data lakehouse.
Once the data lakehouse is constructed properly, the possibilities for analysis are immense. The first possibility is the inclusion of text with structured data. Heretofore it has not been possible to include the two type of data together, but now it is. Once DataBricks reads and restructures its data and once textual ETL reads and reformats its data, the possibilities are endless.
And then there are the analytical capabilities that are possible when other unstructured data is combined with both textual data and structured data.
The data lakehouse – with its base data, its analytical infrastructure – pulling from structured data, text, and other unstructured data is the next frontier of architectural achievement in the world of technology.
Books you may enjoy -
TURNING TEXT INTO GOLD, with Ranjeet Srivastava, Technics Publications, Sedona Arizona
DATA ARCHITECTURE - BUILDING THE FOUNDATION, Technics Publications, Sedona, Arizona
STONE TO SILICON: THISTORY OF TECHNOLOGY AND THE COMPUTER, with Roger Whatley, Technics Publications, Sedona, Arizona